
Analytics
Viewer Geography
See which countries and cities your requests come from, how much bandwidth each consumes, how well content caches for each audience, and how all of that moves through the day.
Geographic Analytics
The Geo Distribution tab in your CDN deployment dashboard maps your traffic by the viewer's location. The world map is a dot grid; every country lights up in proportion to its traffic, with a table underneath. Hover a country for its numbers, click to pin it, scroll to zoom and drag to pan. This tells you where your audience actually is, which markets are growing, and where cache performance needs attention.
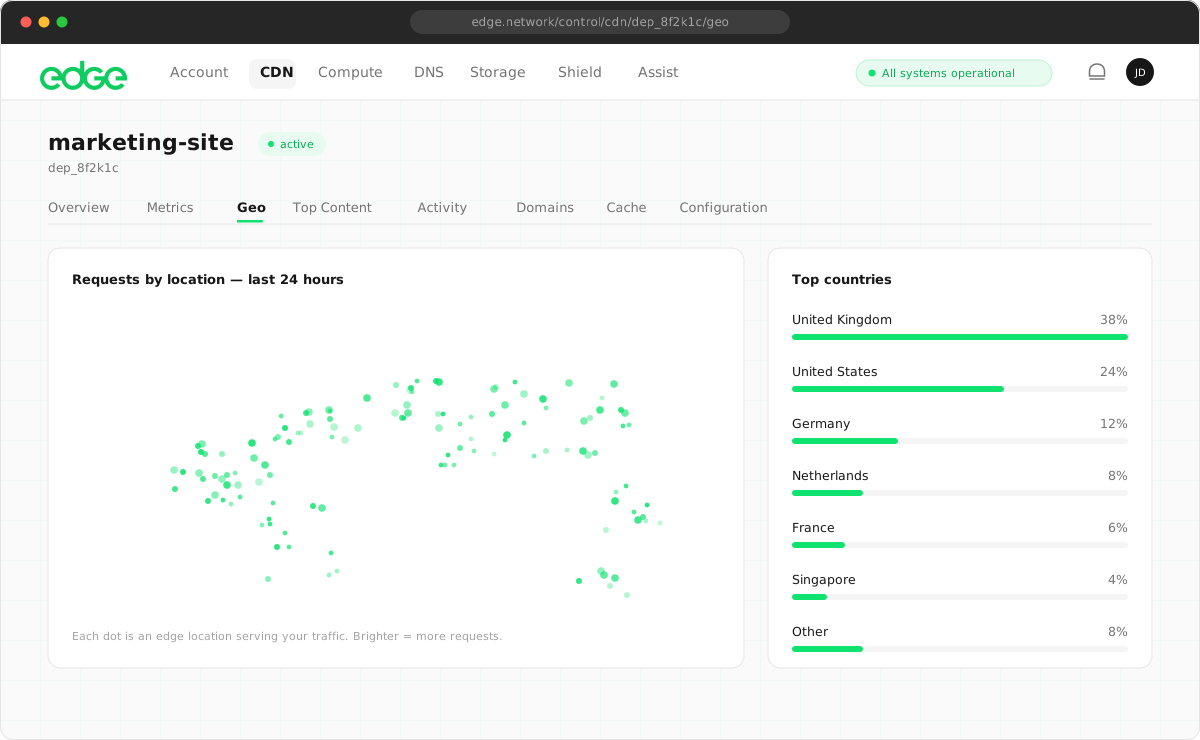
Reading the Map
Share, Bandwidth or Hit Rate
Switch what the colours mean. Share and Bandwidth tint each country by its slice of requests or bytes. Hit rate colours countries from red (under 70%) through amber to green (95%+), so a market with poor cache performance stands out immediately.
Playback
Press play under the map to watch your audience move around the world across the selected period, with the night side shaded so you can see traffic follow the sun. Drag the scrubber to any point, or press Now to return to the whole-period view.
Live
On the 1-hour and 24-hour ranges, countries with traffic in the last minute pulse on the map and a live request rate appears in the card header. It refreshes every 30 seconds while the tab is open.
Cities
Where the edge node can resolve a city, city markers are drawn on top of the country tint, sized by requests, with a Top Cities table below. Zoom into a region to label them. Toggle the markers off with the Cities checkbox.
Regions and Zoom
Jump to Americas, Europe, Africa & Middle East or Asia-Pacific; the country table filters to the region you're looking at. Scroll or use the zoom buttons for anything in between, and drag to pan.
Trends and Export
Every country shows its change against the equivalent preceding period (the hour before, the previous day, the previous week), both in the table and in the tooltip. PNG downloads the map exactly as you have it configured, for reports and decks.
How Viewer Locations are Determined
When an edge node serves a request it resolves the client's IP address against an IP geolocation database held locally on the node. Only the resulting country code and, where available, city name with its centroid coordinates are counted - the address itself is never written to disk or sent anywhere. Counts are aggregated per domain every minute (country) and every hour (city) and stored in your account's analytics database.
Where viewers are, not where servers are
Attribution is based on the viewer's address, not the location of the edge node that served them. A request from Seoul is counted under South Korea regardless of which Edge CDN node handled it.
No Delivery Overhead
Lookups run against an in-memory database on the node in microseconds, after the response has already been chosen. They never delay content delivery.
Privacy by Design
Country and city level only. No IP addresses or per-request records are retained, and city positions are the database's city centroid, not a viewer's position, so the data is aggregate analytics rather than personal data.
Works Behind Proxies
If a domain is marked as proxied (for example through Cloudflare), the original viewer address is read from the proxy's forwarding headers so locations stay accurate. For direct domains those headers are ignored to prevent spoofing.
Unknown Locations
Addresses that can't be resolved (newly allocated ranges, some VPN and satellite providers, or internal monitoring) are grouped under Unknown. This is typically a small fraction of traffic.
Metrics Per Country
Each country shows the following metrics for the selected time range:
Traffic Share
The percentage of all requests in the period that came from viewers in this country.
Requests
Total number of HTTP requests from viewers in this country during the selected time period.
Bandwidth
Total data transferred to viewers in this country, helping identify your heaviest markets.
Cache Hit Rate
Percentage of this country's requests served from cache. A lower rate than your overall average usually means that audience is requesting content the rest of your users aren't.
Use Cases
Knowing where viewers are enables several strategic and operational decisions:
See which countries drive your traffic today and spot emerging markets as they grow.
Localise, translate, or tune assets for the countries with the most viewers.
Plan maintenance windows and releases around the time zones where your audience is concentrated.
Understand which jurisdictions your content reaches for regulatory requirements such as GDPR.
Time Ranges
View viewer geography across different time periods:
Data resolution: Minute-level country data is available for the last 24 hours, and hourly aggregates are used for 7-day and 30-day views. Playback steps by minute on the 1-hour range, by hour on 24 hours and 7 days, and by day on 30 days. City data is hourly.
Data Retention
Viewer geography follows the same retention policy as other CDN analytics: