
Shield
Analytics
Every widget has a Metrics tab in the console with verification volumes, humanity score trends, and failure counts — built entirely from hourly aggregates.
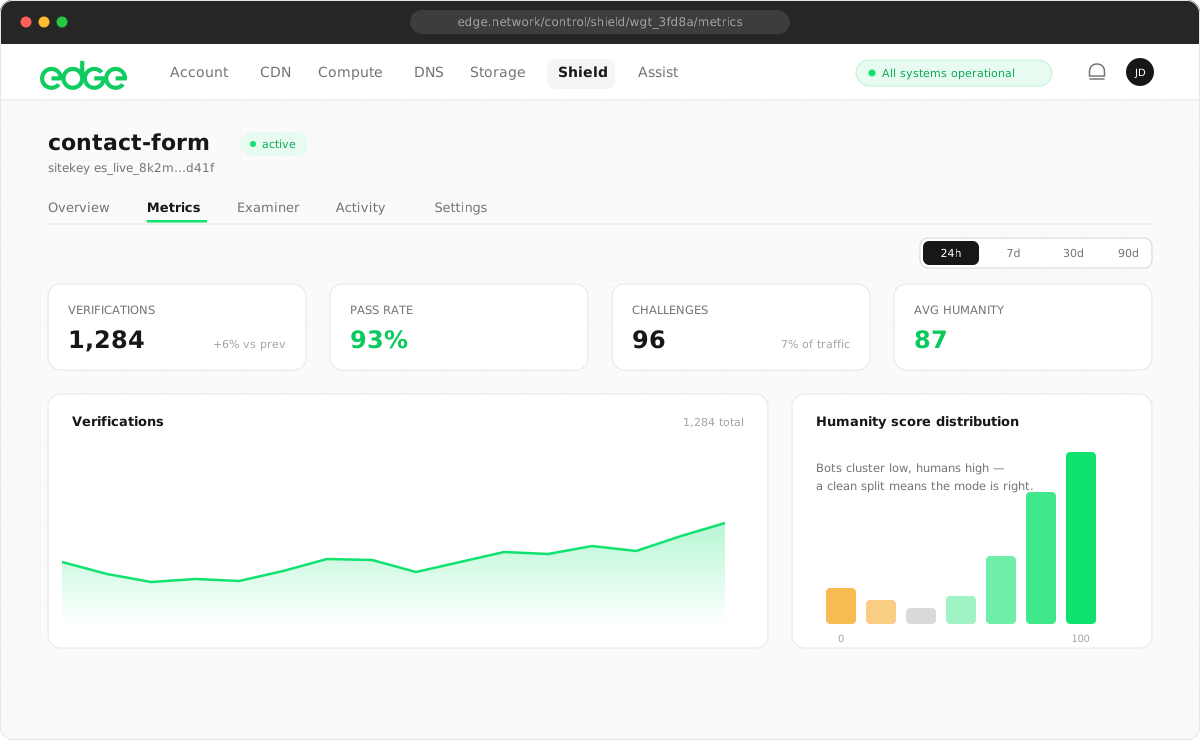
Available Metrics
Open Shield → your widget → Metrics and select a range (24 hours, 7 days, or 30 days):
| Metric | What it tells you |
|---|---|
| Verifications | Successful siteverify calls — traffic your server accepted a token for |
| Challenges issued | How many verification attempts started — the widget's raw traffic |
| Average humanity score | Score trend over time — a sudden drop is an early warning of a bot campaign |
| Solve rate | Challenges solved ÷ issued — low rates suggest clients abandoning or failing the challenge |
| Interactive shown | How often managed mode escalated to the "I am human" confirmation |
| Failed / replayed | Rejected siteverify calls, including replay attempts — your token-abuse signal |
| Tarpit challenges | Escalated-difficulty challenges served to repeat offenders — how hard the tarpit is working |
| Shadow would-fail / would-escalate | For widgets in shadow (report-only) mode: what strict enforcement would have rejected or escalated — your trial scorecard |
Reading the Data
-
Average score falling while volume rises usually means automated traffic has arrived. Check the interactive-shown count — in managed mode it should rise with it. -
Replays above zero mean something is resubmitting used tokens — typically a naive bot re-posting a captured form. Shield rejects these automatically. -
Issued far exceeding verifications is normal — every page load with a widget issues a challenge, but only submitted forms reach siteverify.
Data Retention & Privacy
All analytics are hourly aggregate counters per widget. Shield does not store visitor IP addresses, fingerprints, cookies, or any per-visitor records — the signals used for scoring are processed in memory during the request and discarded. There is no per-visitor drill-down because there is no per-visitor data.
This is what makes Shield GDPR/CCPA-friendly by default: there's nothing to consent to, export, or delete.